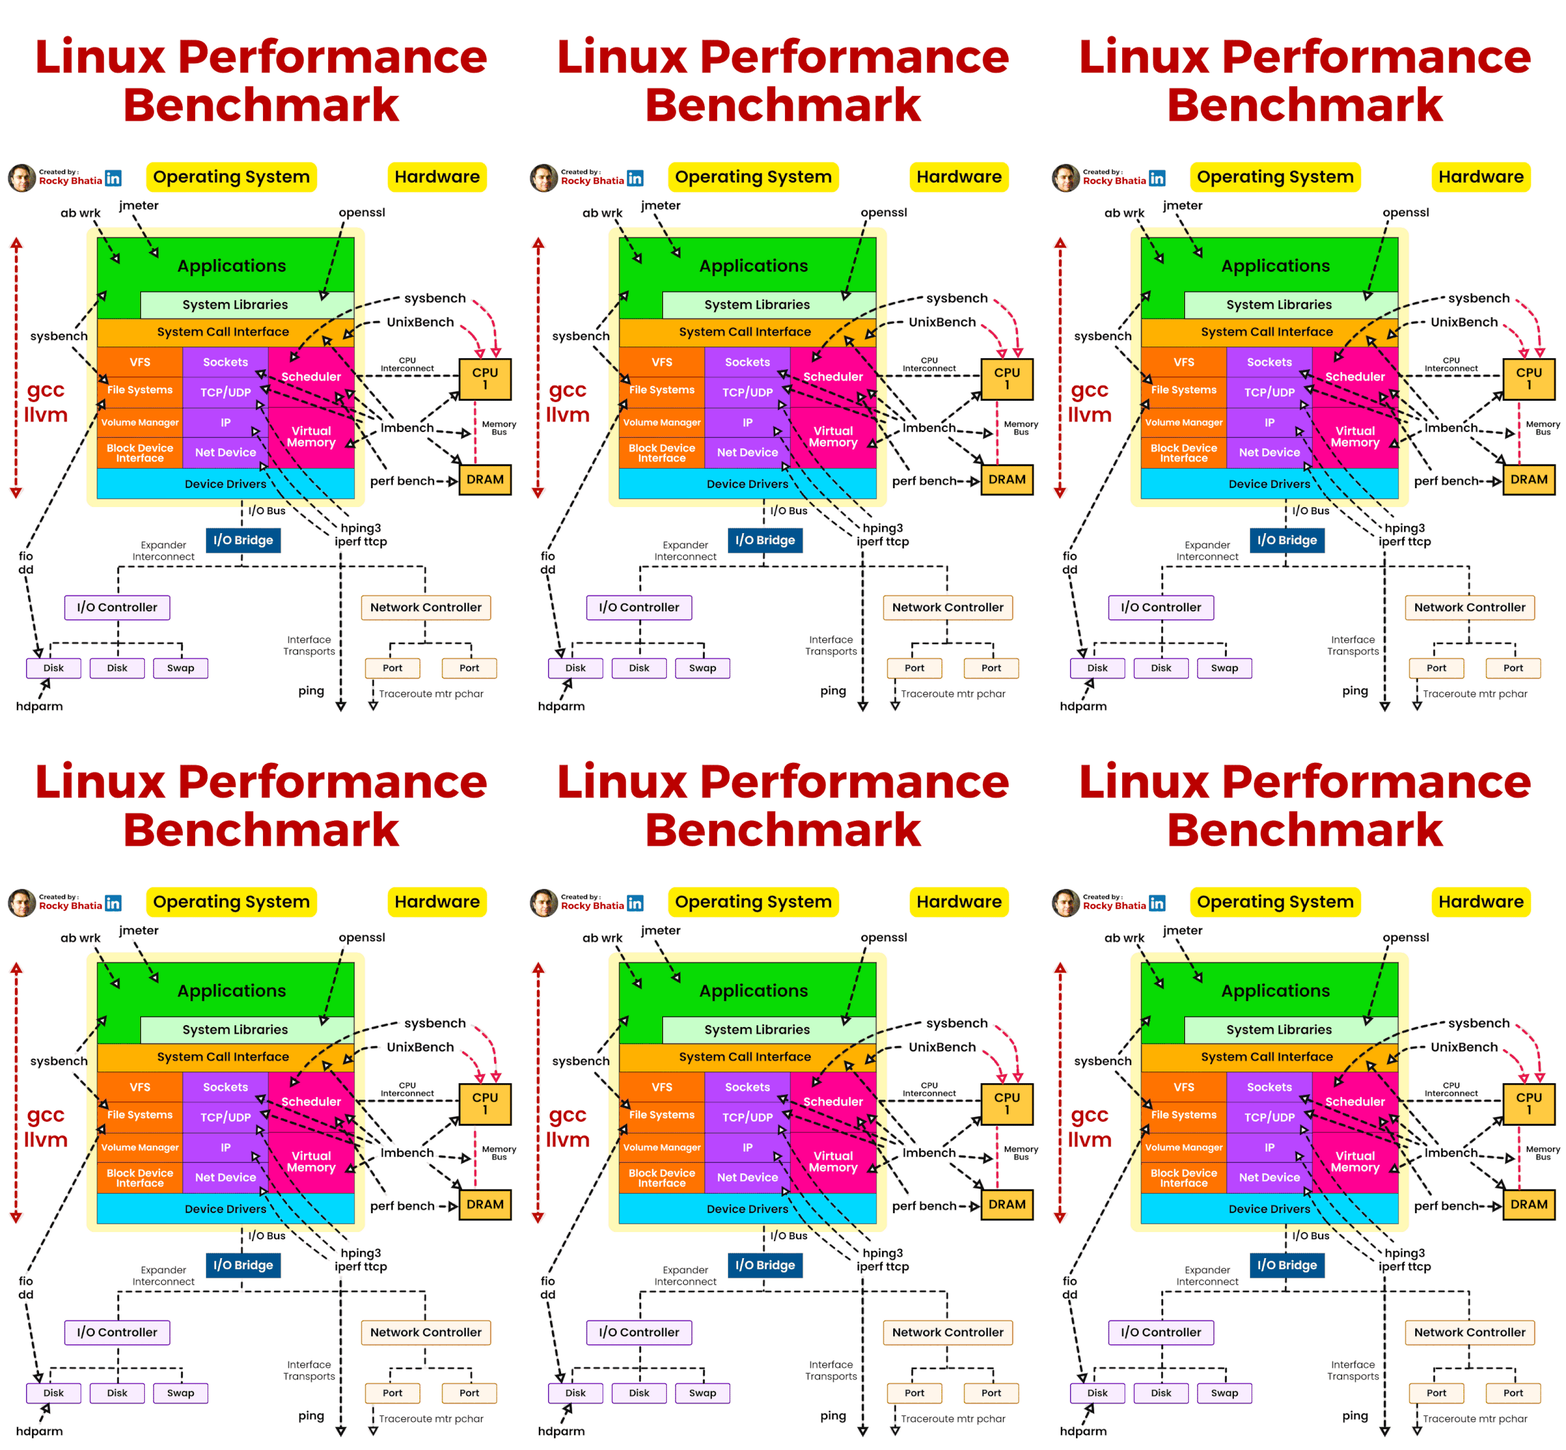
Popular interview question: how to diagnose a mysterious process that’s taking too much CPU, memory, IO, etc?
The diagram above illustrates helpful tools in a Linux system.
‘vmstat’ – reports information about processes, memory, paging, block IO, traps, and CPU activity.
‘iostat’ – reports CPU and input/output statistics of the system.
‘netstat’ – displays statistical data related to IP, TCP, UDP, and ICMP protocols.
‘lsof’ – lists open files of the current system.
‘pidstat’ – monitors the utilization of system resources by all or specified processes, including CPU, memory, device IO, task switching, threads, etc.
This post is based on research from many Netflix engineering blogs and open-source projects. If you come across any inaccuracies, please feel free to inform us.
Mobile and web: Netflix has adopted Swift and Kotlin to build native mobile apps. For its web application, it uses React.
Frontend/server communication: GraphQL.
Backend services: Netflix relies on ZUUL, Eureka, the Spring Boot framework, and other technologies.
Databases: Netflix utilizes EV cache, Cassandra, CockroachDB, and other databases.
Messaging/streaming: Netflix employs Apache Kafka and Fink for messaging and streaming purposes.
Video storage: Netflix uses S3 and Open Connect for video storage.
Data processing: Netflix utilizes Flink and Spark for data processing, which is then visualized using Tableau. Redshift is used for processing structured data warehouse information.
CI/CD: Netflix employs various tools such as JIRA, Confluence, PagerDuty, Jenkins, Gradle, Chaos Monkey, Spinnaker, Altas, and more for CI/CD processes.
1 – O(1) This is the constant time notation. The runtime remains steady regardless of input size. For example, accessing an element in an array by index and inserting/deleting an element in a hash table.
2 – O(n) Linear time notation. The runtime grows in direct proportion to the input size. For example, finding the max or min element in an unsorted array.
3 – O(log n) Logarithmic time notation. The runtime increases slowly as the input grows. For example, a binary search on a sorted array and operations on balanced binary search trees.
4 – O(n^2) Quadratic time notation. The runtime grows exponentially with input size. For example, simple sorting algorithms like bubble sort, insertion sort, and selection sort.
5 – O(n^3) Cubic time notation. The runtime escalates rapidly as the input size increases. For example, multiplying two dense matrices using the naive algorithm.
6 – O(n logn) Linearithmic time notation. This is a blend of linear and logarithmic growth. For example, efficient sorting algorithms like merge sort, quick sort, and heap sort
7 – O(2^n) Exponential time notation. The runtime doubles with each new input element. For example, recursive algorithms solve problems by dividing them into multiple subproblems.
8 – O(n!) Factorial time notation. Runtime skyrockets with input size. For example, permutation-generation problems.
9 – O(sqrt(n)) Square root time notation. Runtime increases relative to the input’s square root. For example, searching within a range such as the Sieve of Eratosthenes for finding all primes up to n.
Step 1: The process starts with a product owner creating user stories based on requirements.
Step 2: The dev team picks up the user stories from the backlog and puts them into a sprint for a two-week dev cycle.
Step 3: The developers commit source code into the code repository Git.
Step 4: A build is triggered in Jenkins. The source code must pass unit tests, code coverage threshold, and gates in SonarQube.
Step 5: Once the build is successful, the build is stored in artifactory. Then the build is deployed into the dev environment.
Step 6: There might be multiple dev teams working on different features. The features need to be tested independently, so they are deployed to QA1 and QA2.
Step 7: The QA team picks up the new QA environments and performs QA testing, regression testing, and performance testing.
Steps 8: Once the QA builds pass the QA team’s verification, they are deployed to the UAT environment.
Step 9: If the UAT testing is successful, the builds become release candidates and will be deployed to the production environment on schedule.
Step 10: SRE (Site Reliability Engineering) team is responsible for prod monitoring.