linux
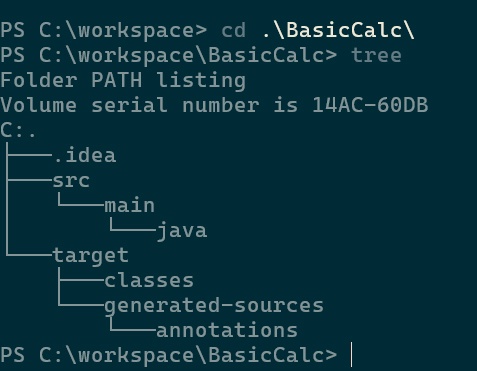
Tree Linux Command
Simply typing ‘tree’ into a Linux terminal will output the directory structure of your app:
Linux & File System
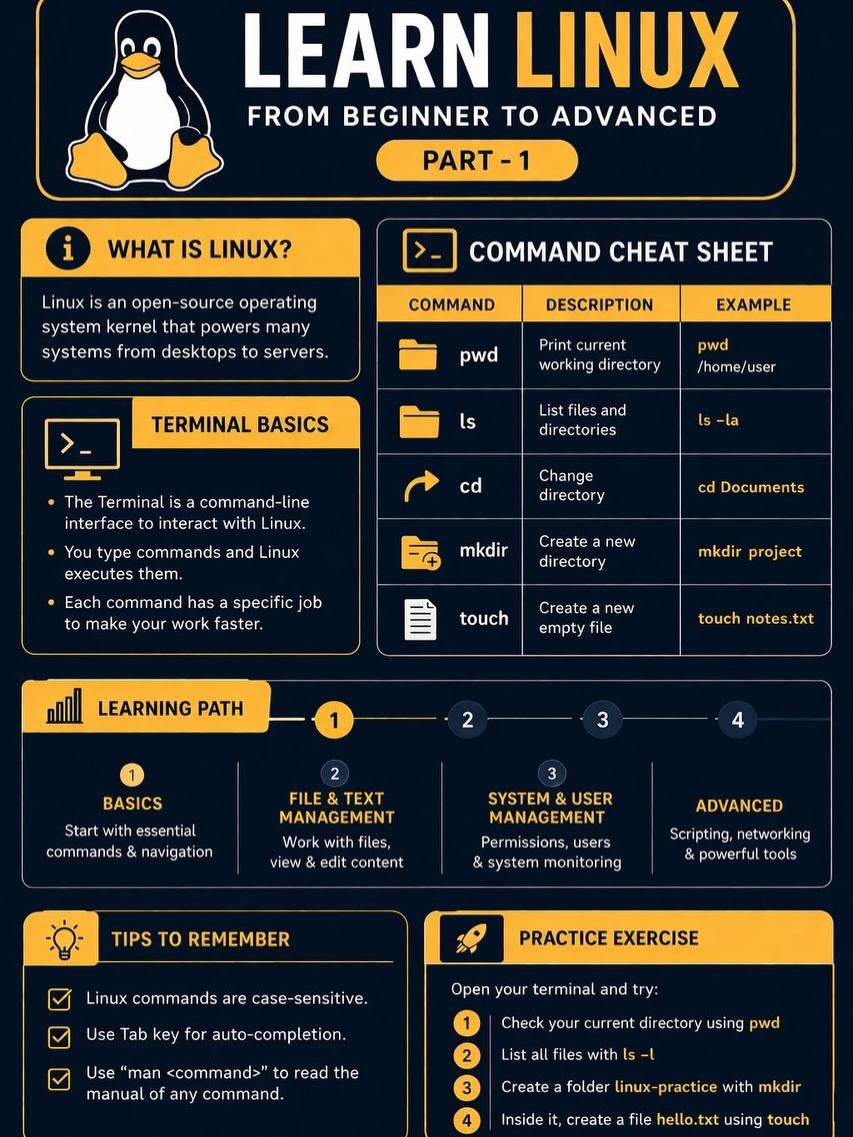
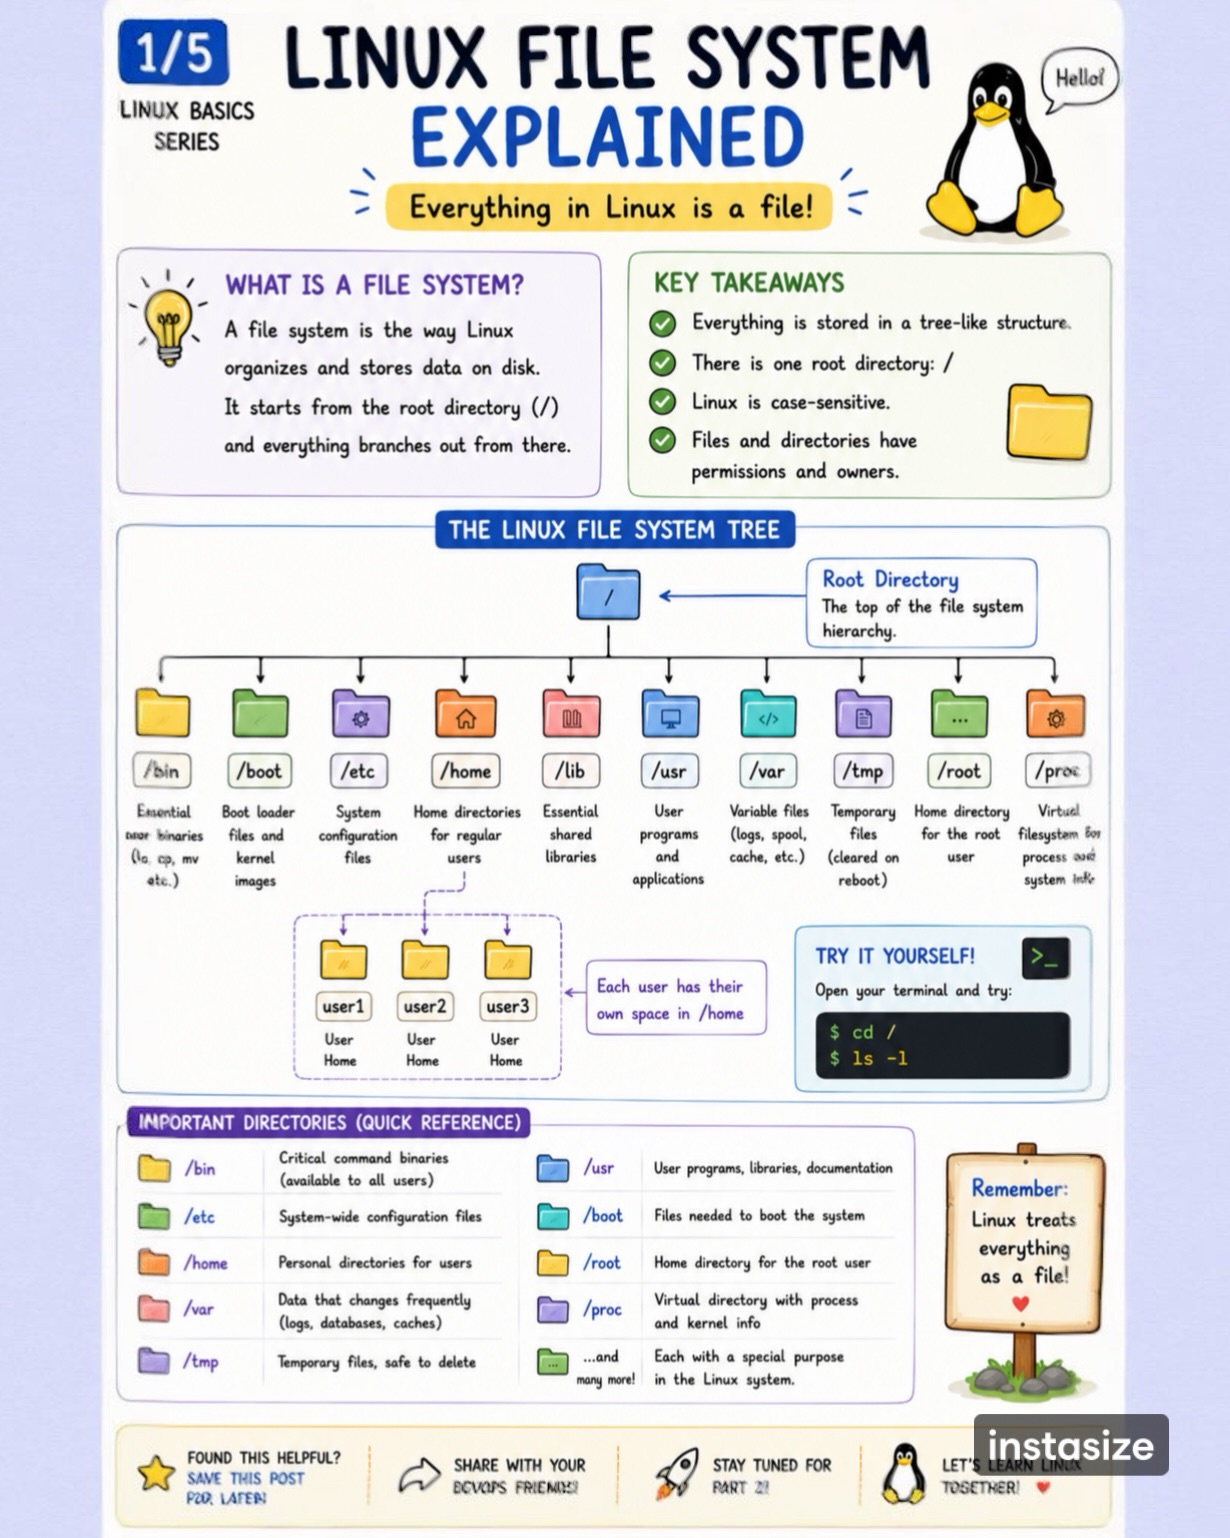
Learn Linux (part 1)
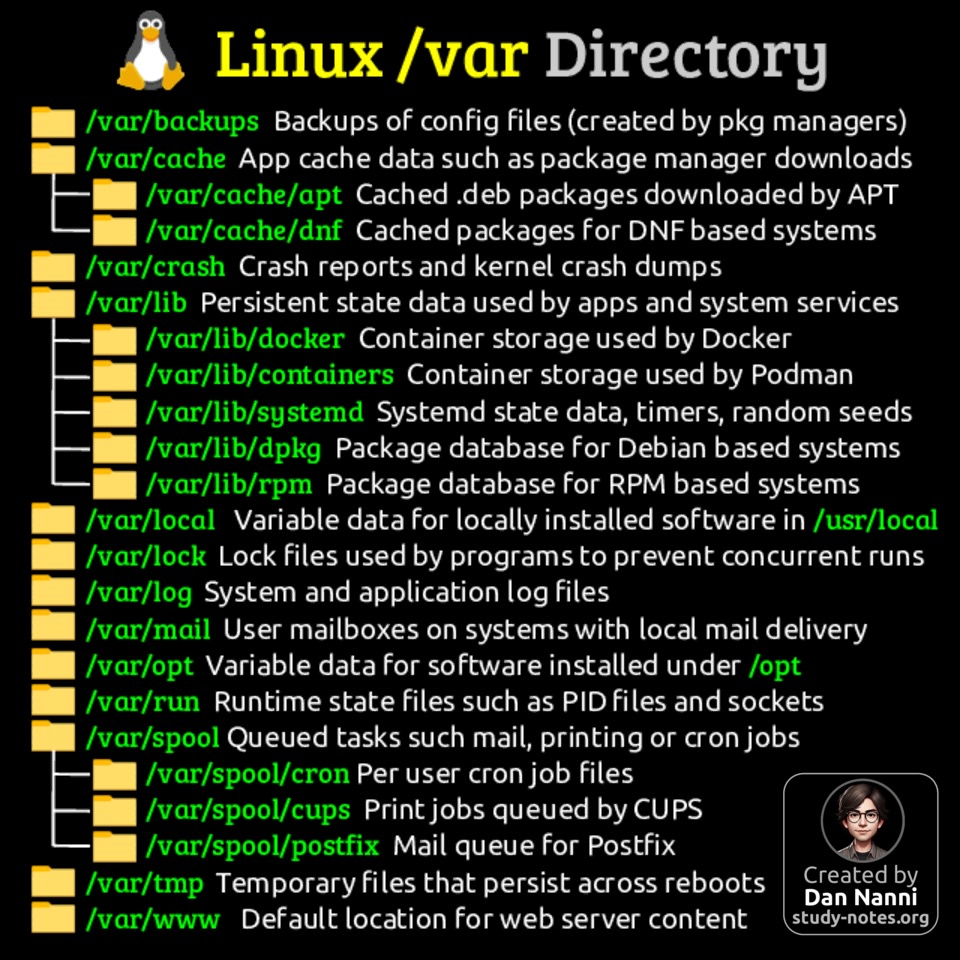
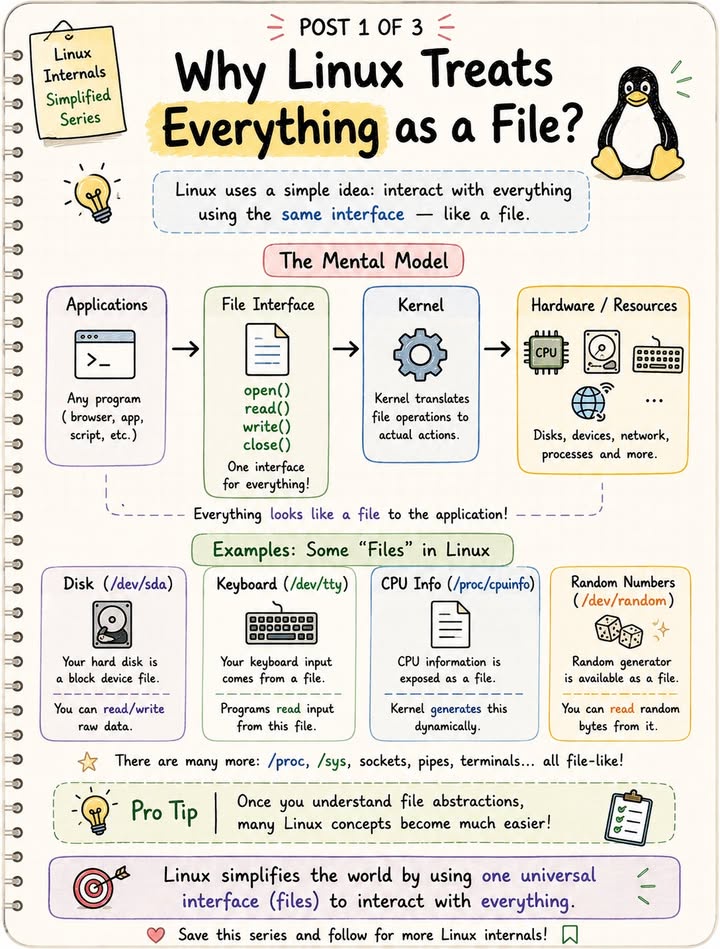
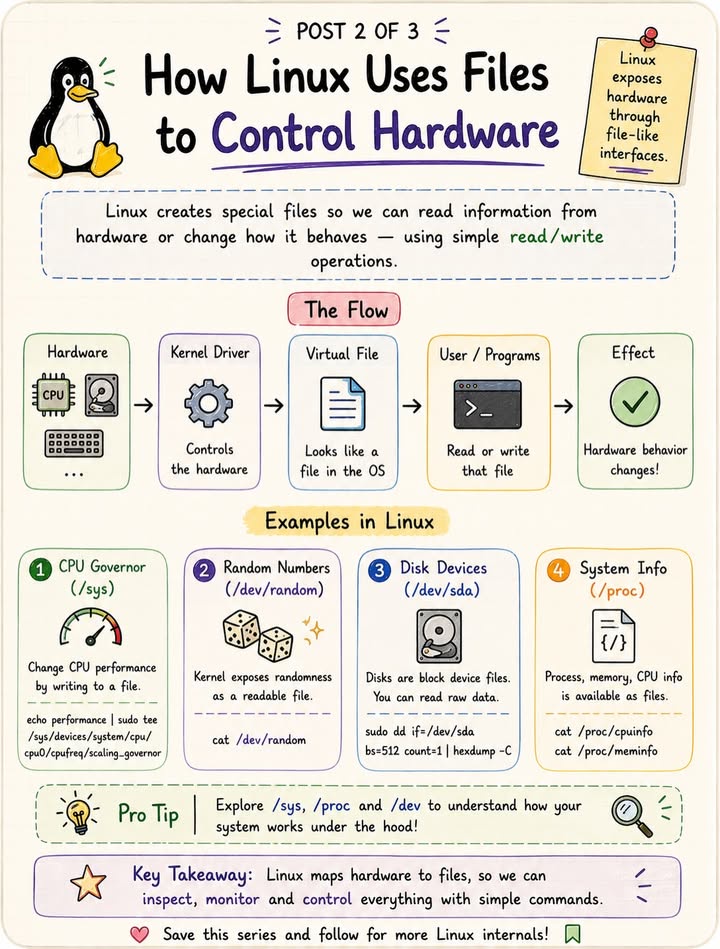
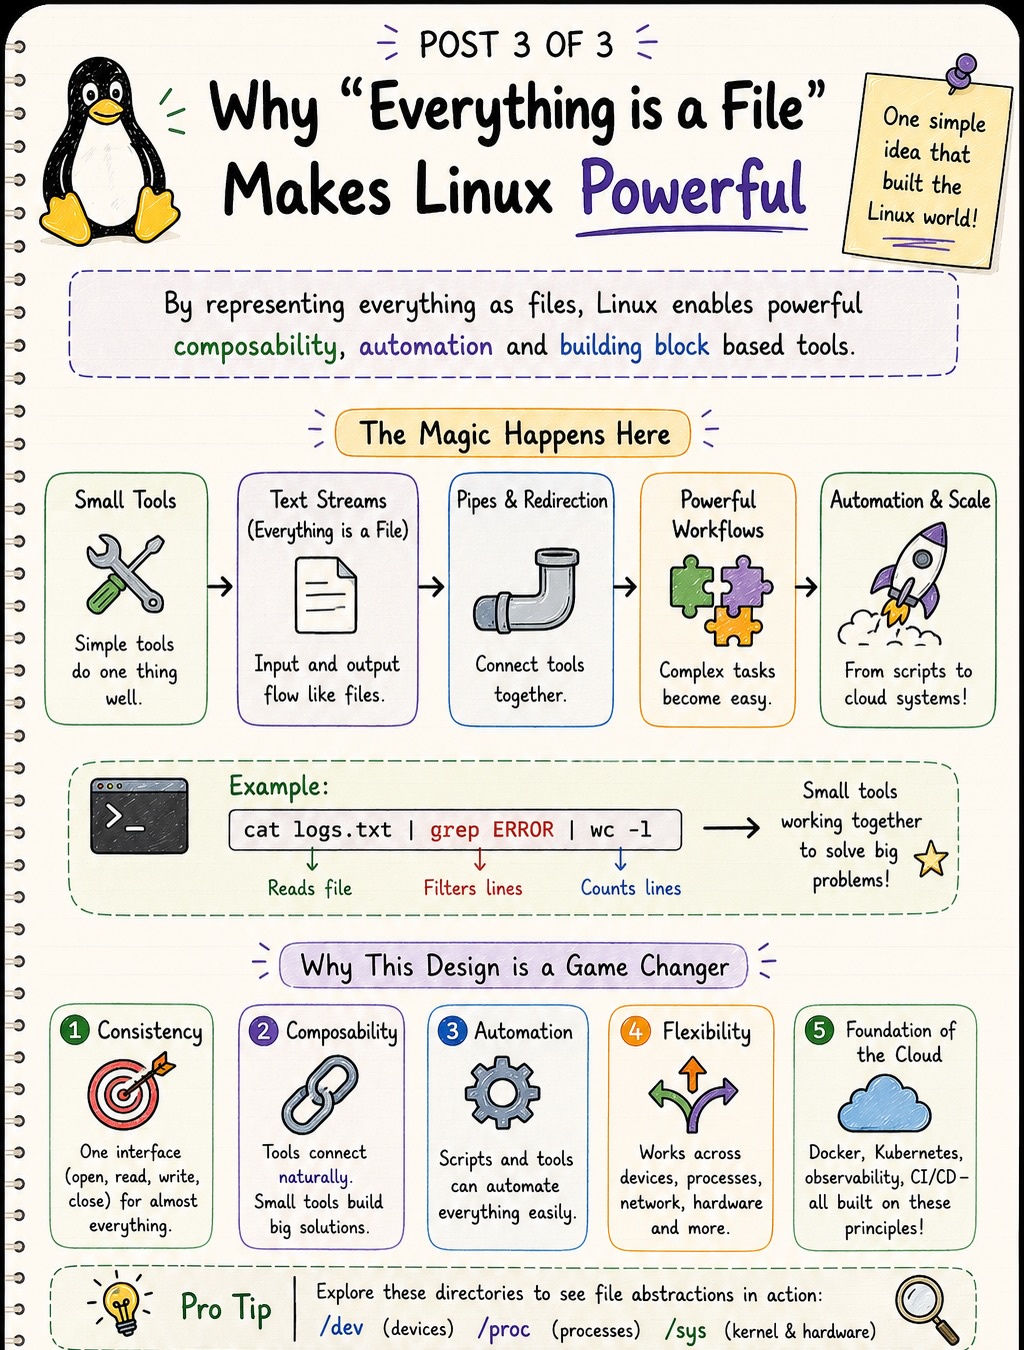
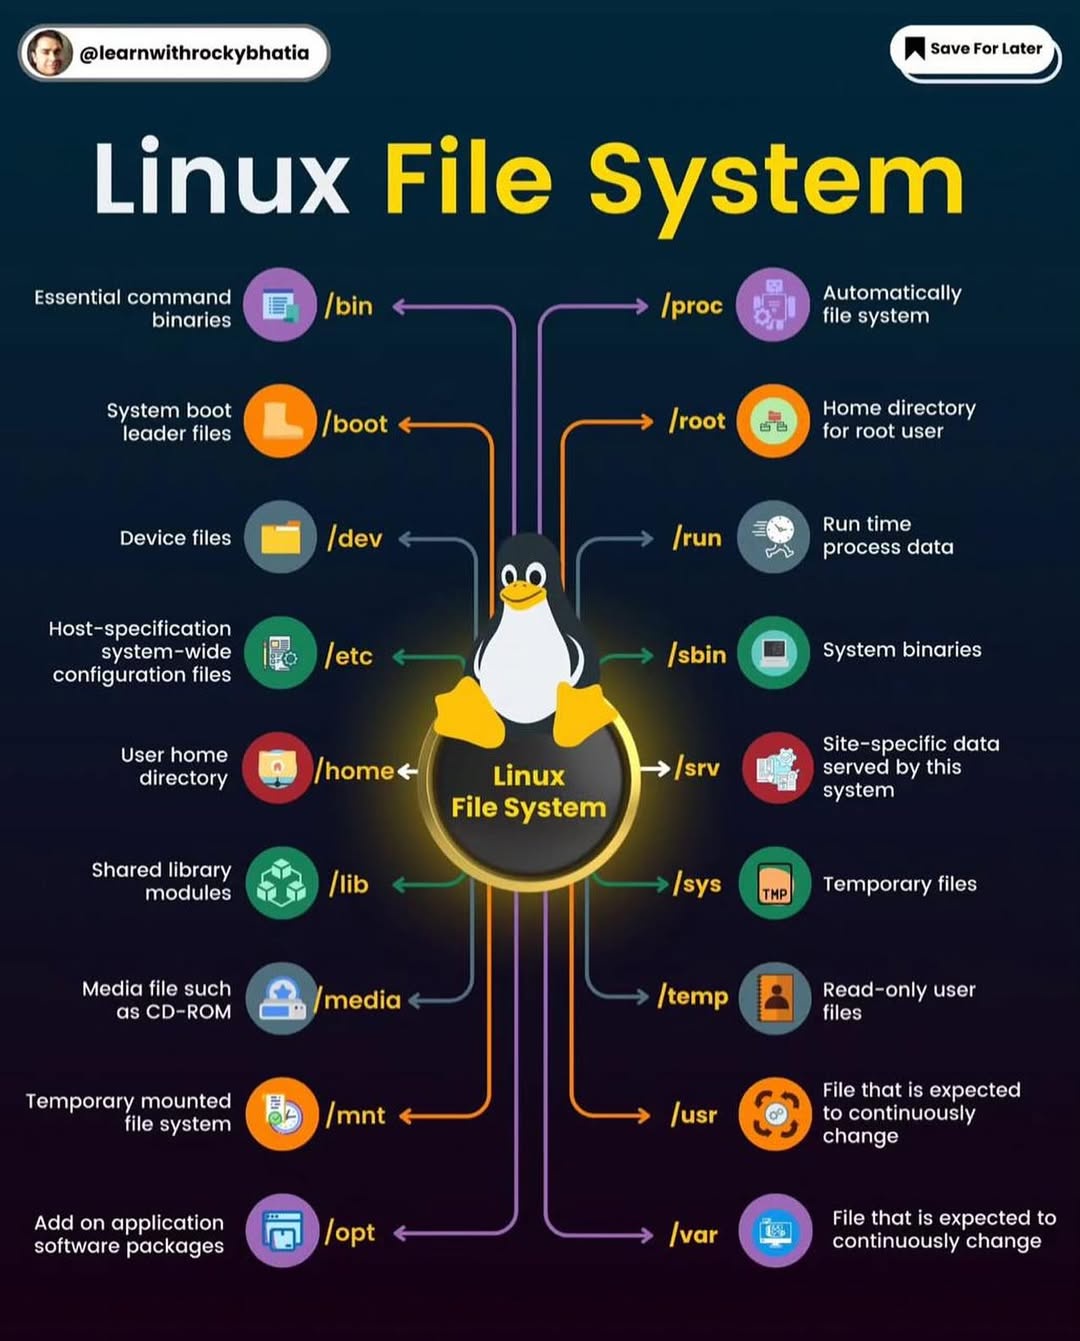
Linux File System Explained
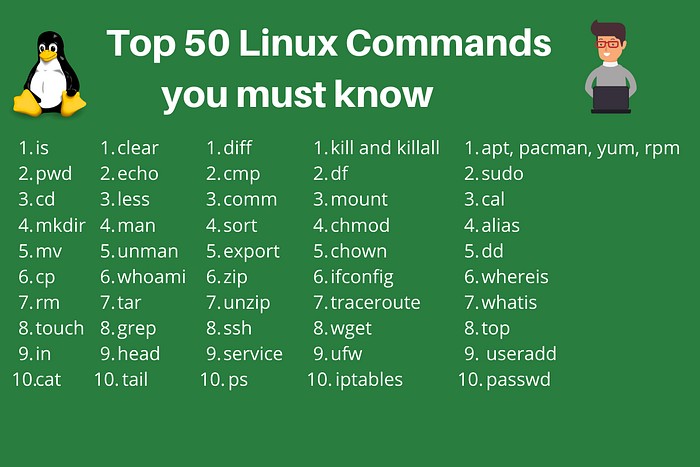
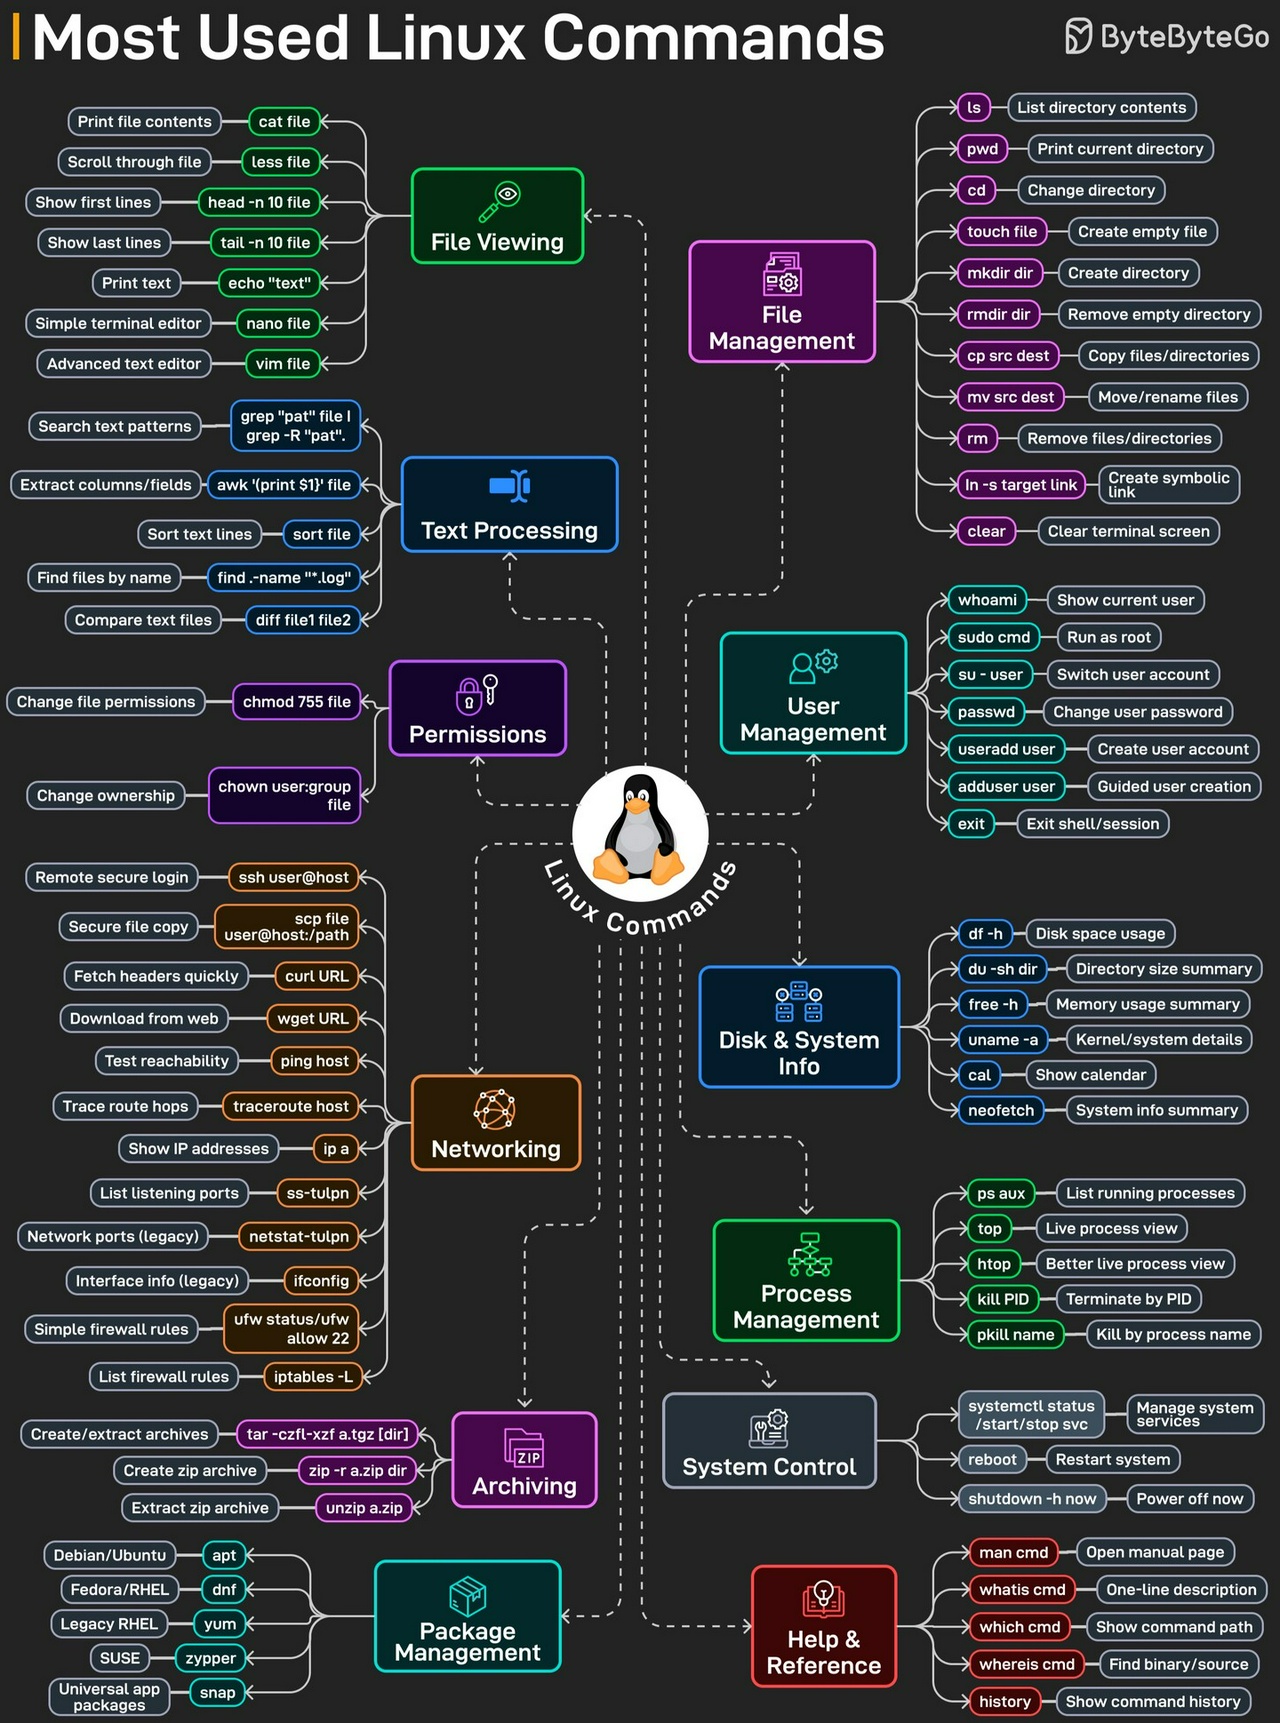
Linux: Important Commands
Linux Performance Benchmark
#linux #benchmark #performance
𝐀𝐧𝐚𝐥𝐲𝐳𝐞 𝐀𝐧𝐲 𝐋𝐢𝐧𝐮𝐱 𝐒𝐲𝐬𝐭𝐞𝐦 𝐢𝐧 𝟔𝟎 𝐒𝐞𝐜𝐨𝐧𝐝𝐬
In 60 seconds you can get a high level idea of system resource usage and running processes by running the following ten commands:
1. uptime This is a quick way to view the load averages, which indicate the number of tasks (processes) wanting to run
2. dmesg | tail This views the last 10 system messages, if there are any. Look for errors that can cause performance issues.
3. vmstat 1 Short for virtual memory stat, vmstat(8) is a commonly available tool (first created for BSD decades ago). It prints a summary of key server statistics on each line.
4. mpstat -P ALL 1 This command prints CPU time breakdowns per CPU, which can be used to check for an imbalance. A single hot CPU can be evidence of a single-threaded application.
5. pidstat 1 Pidstat is a little like top’s per-process summary, but prints a rolling summary instead of clearing the screen. This can be useful for watching patterns over time, and also recording what you saw (copy-n-paste) into a record of your investigation.
6. iostat -xz 1 This is a great tool for understanding block devices (disks), both the workload applied and the resulting performance.
7. free -m
8. sar -n DEV 1 check network interface throughput: rxkB/s and txkB/s, as a measure of workload, and also to check if any limit has been reached
9. sar -n TCP,ETCP 1 This is a summarized view of some key TCP metrics
10. top The top command includes many of the metrics we checked earlier. It can be handy to run it to see if anything looks wildly different from the earlier commands, which would indicate that load is variable.
Linux: Files & System
How Linux Works
Embark on a journey through the intricate workings of a Linux system, from the moment you hit the power button to the seamless execution of your commands and programs. Dive into the orchestration between user interaction and kernel management that powers every aspect of your computing experience.
Power On: Your journey starts with the push of that power button. The system comes to life, and the BIOS (Basic Input/Output System) kicks in, ensuring your hardware is in top shape.
Master Boot Record: BIOS hands over control to the MBR on your hard disk, which then directs the boot loader to its designated spot.
Boot loader: Picture the boot loader as the conductor, signaling for the kernel to take the stage.
4️⃣ Kernel: Ah, the kernel – Linux's heart and soul. It acts as the liaison between your hardware and the tasks you want to perform.
5️⃣ Initial RAM: The kernel settles into memory, and the system initializes with '/sbin/init' at the helm.
6️⃣ User Space: Now you're in control, with the shell and GUI ready to take your commands.
🔁 Cycle of Operation: - User Mode: You interact with the system, requesting programs or commands to run. - System Mode: When tasks require more privilege, like hardware access, the kernel intervenes, managing requests securely.
🛠️ Kernel's Toolbox: - Process Management: Handling the multitude of tasks you've got going. - Memory Management: Allocating space for your applications and data. - Device Drivers: Communicating with your hardware, from mouse to USB drive. - System Calls: Special requests made by programs. - File System Management: Organizing and storing your files securely.
🧠 Brain of the Operation: The kernel communicates with CPU, memory, disk, and network to ensure smooth execution of your commands and programs.